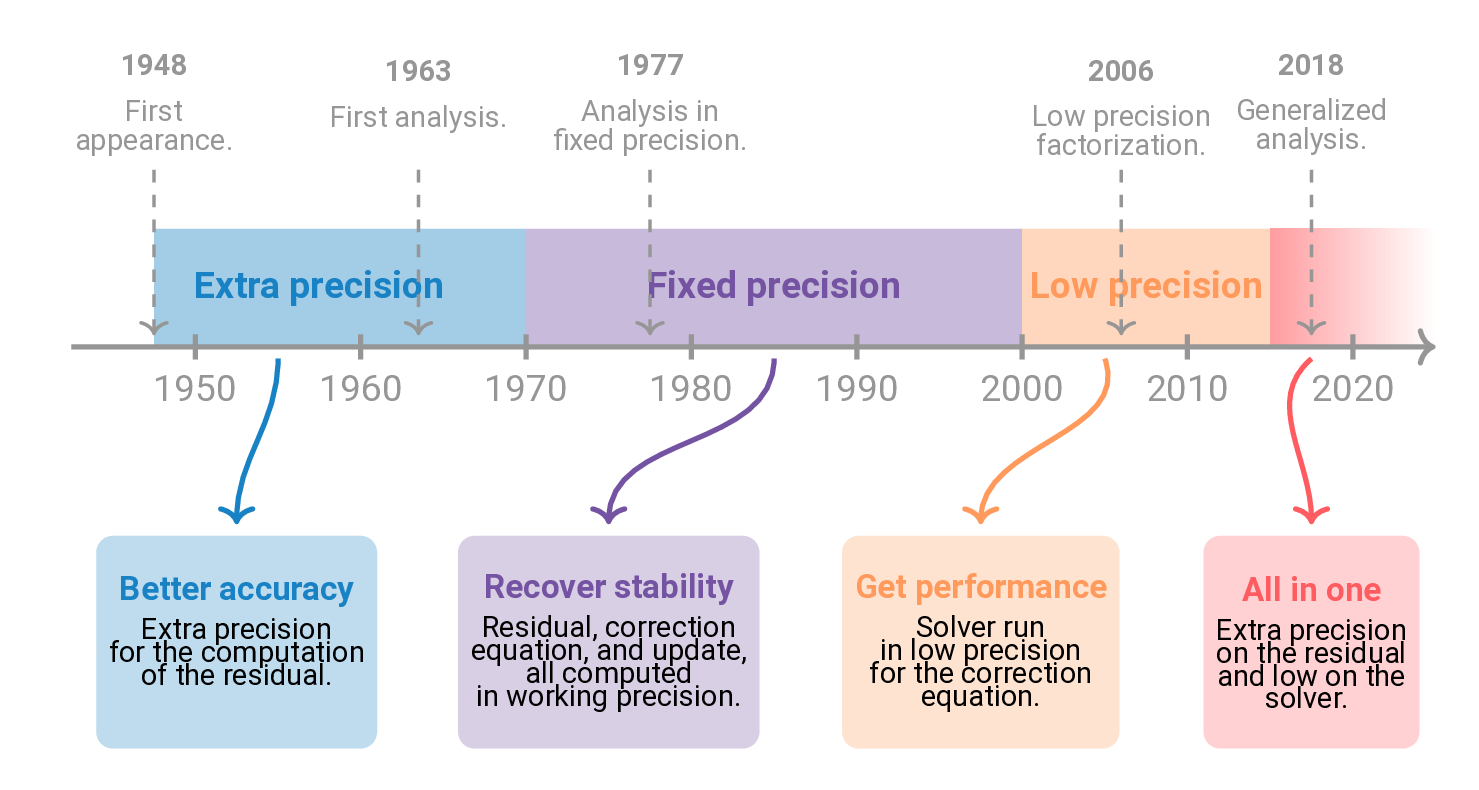
Timeline
A timeline made in Tikz.

1
2
3
4
5
6
7
8
9
10
11
12
13
14
15
16
17
18
19
20
21
22
23
24
25
26
27
28
29
30
31
32
33
34
35
36
37
38
39
40
41
42
43
44
45
46
47
48
49
50
51
52
53
54
55
56
57
58
59
60
61
62
63
64
65
66
67
68
69
70
71
72
73
74
75
76
77
78
79
80
81
82
83
84
85
86
87
88
89
90
91
92
93
94
95
96
97
98
99
100
101
102
103
104
105
106
107
108
109
110
111
112
113
114
115
116
117
118
119
 %%% Full, compilable sources are on Github:
%%% https://github.com/bvieuble/TeXFantasy/tree/main/illustrations/fig1
%%% Appears in my lecture ``Mixed precision iterative refinement'' (2023).

% Compiled with XeLaTeX
% TeX-command-extra-options: "-shell-escape"
\documentclass[convert={outext=.png},border=10pt]{standalone}
\usepackage{tikz}
\usetikzlibrary{calc,arrows.meta}

\input{color_theme.tex}

\begin{document}

\tikzstyle{descript} = [text=black,align=center, minimum height=1.8cm,
                        align=center, outer sep=0pt,font=\footnotesize]
\tikzstyle{activity} = [align=center,outer sep=1pt]

\begin{tikzpicture}[very thick, black, x=0.7cm]\small

    %% Coordinates
    \coordinate (O) at (-1.5,0);
    \coordinate (P1) at (4,0);
    \coordinate (P2) at (10,0);
    \coordinate (P3) at (13,0);
    \coordinate (F) at (15,0);
    \coordinate (E1) at (-0.5,0);
    \coordinate (E2) at (2.7,0);
    \coordinate (E3) at (5.5,0);
    \coordinate (E4) at (11.2,0);
    \coordinate (E5) at (13.5,0);

    %% Filled regions
    \fill[color=myblue-light] rectangle ($(O)+(1,0)$) -- (P1) -- ($(P1)+(0,1)$)
    -- ($(O)+(1,1)$);
    \fill[color=mypurple-light] rectangle (P1) -- (P2) -- ($(P2)+(0,1)$) --
        ($(P1)+(0,1)$); % Work
    \fill[color=myorange-light] rectangle (P2) -- (P3) -- ($(P3)+(0,1)$) --
        ($(P2)+(0,1)$); % Current work
    \shade[left color=myred-mild] ($(P3)$) rectangle ($(F)+(0,1)$);

    %% Text inside filled regions
    \draw ($(P1)+(-2.5,0.5)$) node[activity,myblue] {\textbf{Extra precision}};
    \draw ($(P2)+(-3,0.5)$) node[activity,mypurple] {\textbf{Fixed precision}};
    \draw ($(P3)+(-1.5,0.5)$)  node[activity,myorange]
        {\textbf{Low precision}};

    %% Description
    \node[descript,fill=myblue-light!70,text=myblue,rounded corners] (D1) at
        ($(P1)+(-3.5,-2.5)$) {
      \textbf{Better accuracy}\\
      \scriptsize \color{black}Extra precision \\[-4pt] \scriptsize
        \color{black}for the computation \\[-4pt] \scriptsize \color{black}of
        the residual.\\[-4pt]};

    \node[descript,fill=mypurple-light!70,text=mypurple,rounded corners] (D2)
        at ($(P2)+(-5,-2.5)$) {
      \textbf{Recover stability}\\
      \scriptsize \color{black}Residual, correction \\[-4pt] \scriptsize
      \color{black}equation, and update, \\[-4pt] \scriptsize \color{black}all
      computed \\[-4pt] \scriptsize \color{black}in working precision.};

    \node[descript,fill=myorange-light!70,text=myorange,rounded corners] (D3)
        at ($(P3)+(-3.5,-2.5)$) {
      \textbf{Get performance}\\
      \scriptsize \color{black}Solver run \\[-4pt]
        \scriptsize \color{black}in low precision \\[-4pt] \scriptsize
        \color{black}for the correction \\[-4pt] \scriptsize
        \color{black}equation.};

    \node[descript,fill=myred-light!70,text=myred,rounded corners] (D4) at
        ($(F)+(-1.5,-2.5)$) {
      \textbf{All in one}\\
      \scriptsize \color{black}Extra precision \\[-4pt] \scriptsize
      \color{black}on the residual \\[-4pt] \scriptsize \color{black}and low on
      the \\[-4pt] \scriptsize \color{black}solver.
        };

    %% Events
    \draw[<-,thick,color=black,dashed] ($(E1)+(0,0.1)$) -- ($(E1)+(0,1.5)$)
    node [above=0pt,align=center,black] {\scriptsize \textbf{1948} \\
    \scriptsize First \\[-4pt]\scriptsize appearance.};
    \draw[<-,thick,color=black,dashed] ($(E2)+(0,0.1)$) -- ($(E2)+(0,1.5)$)
    node [above=0pt,align=center,black] {\scriptsize \textbf{1963} \\
    \scriptsize First analysis. \\[-4pt]};
    \draw[<-,thick,color=black,dashed] ($(E3)+(0,0.1)$) -- ($(E3)+(0,1.5)$)
    node [above=0pt,align=center,black] {\scriptsize \textbf{1977} \\
    \scriptsize Analysis in \\[-4pt] \scriptsize fixed precision.};
    \draw[<-,thick,color=black,dashed] ($(E4)+(0,0.1)$) -- ($(E4)+(0,1.5)$)
    node [above=0pt,align=center,black] {\scriptsize \textbf{2006} \\
    \scriptsize Low precision \\[-4pt] \scriptsize factorization.};
    \draw[<-,thick,color=black,dashed] ($(E5)+(0,0.1)$) -- ($(E5)+(0,1.5)$)
    node [above=0pt,align=center,black] {\scriptsize \textbf{2018} \\
    \scriptsize Generalized \\[-4pt] \scriptsize analysis.};

    %% Arrows
    \path[->,color=myblue] ($(P1)+(-3,-0.1)$) edge [out=-90, in=90]
      ($(D1)+(0,1)$);
    \path[->,color=mypurple] ($(P2)+(-3,-0.1)$) edge [out=-90, in=90]
      ($(D2)+(0,1)$);
    \path[->,color=myorange]($(P3)+(-2,-0.1)$)  edge [out=-70, in=90]
      ($(D3)+(0,1)$);
    \path[->,color=myred]($(F)+(-1.5,-0.1)$)  edge [out=-140, in=90]
      ($(D4)+(0,1)$);
    \draw[->] (O) -- (F);

    %% Ticks
    \foreach \x in {0,2,...,14}
    \draw(\x,3pt) -- (\x,-3pt);

    %% Labels
    \foreach \i \j in
    {0/1950,2/1960,4/1970,6/1980,8/1990,10/2000,12/2010,14/2020}{
      \draw (\i,0) node[below=3pt] {\j} ;
    }

\end{tikzpicture}

\end{document}