Bar plot (gif)
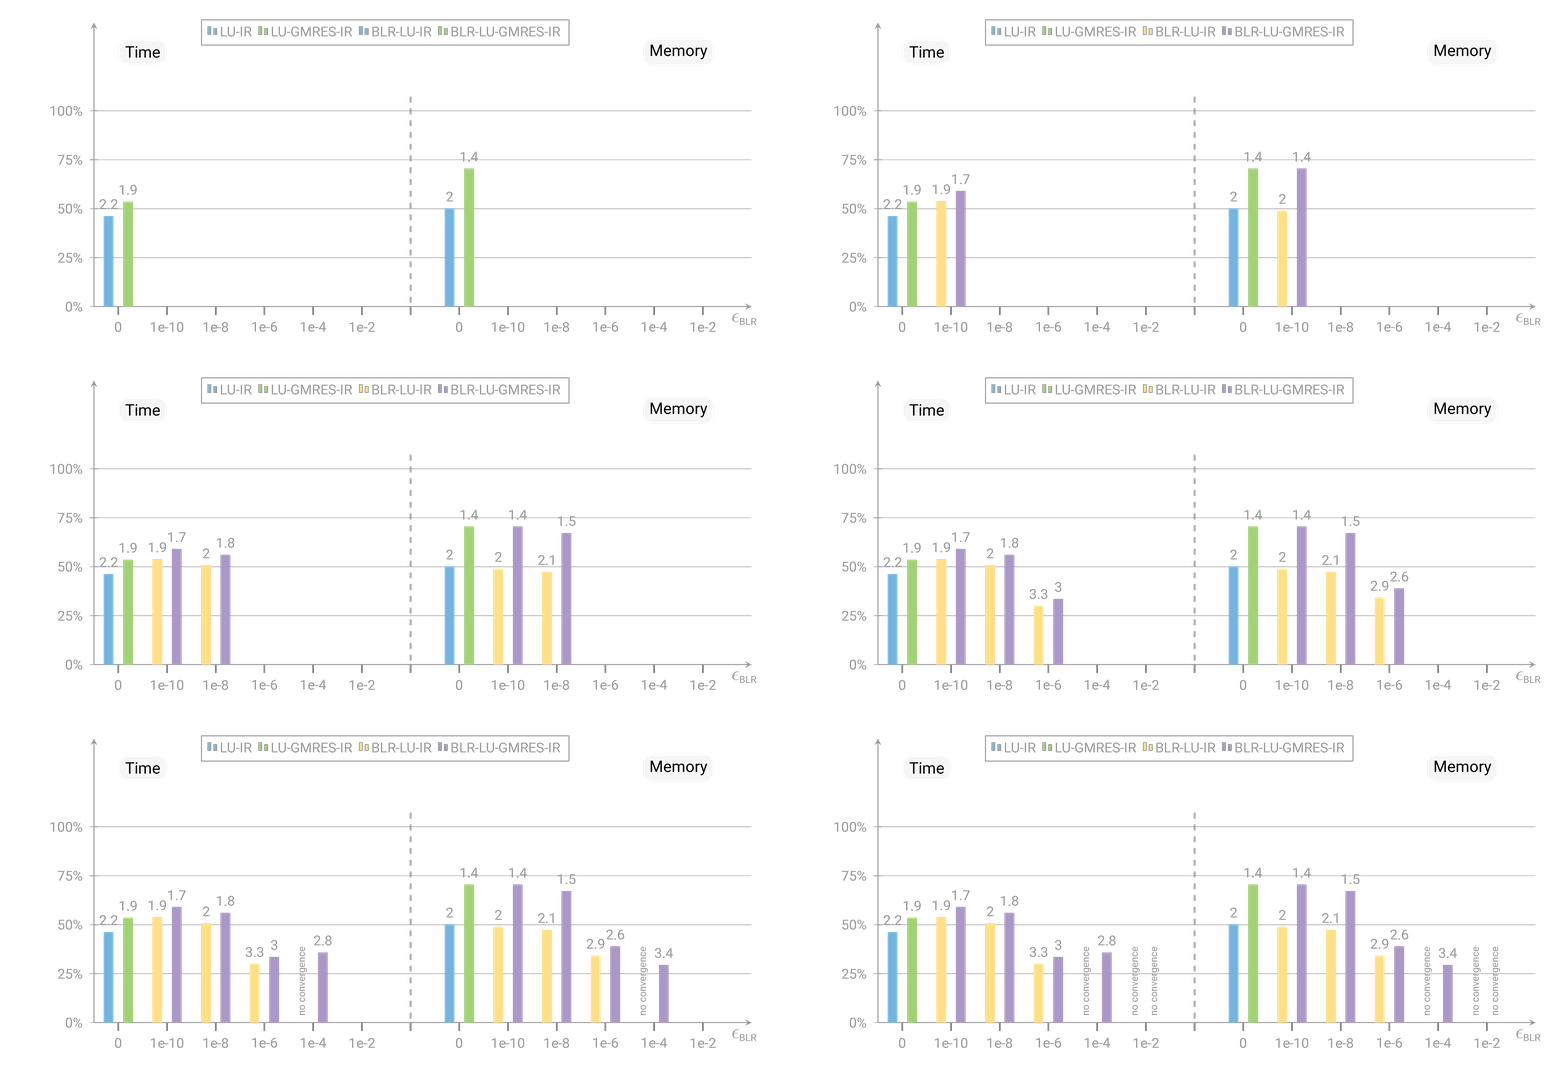
A bar plot representing the execution time and the memory consumption for different threshold parameters.

1
2
3
4
5
6
7
8
9
10
11
12
13
14
15
16
17
18
19
20
21
22
23
24
25
26
27
28
29
30
31
32
33
34
35
36
37
38
39
40
41
42
43
44
45
46
47
48
49
50
51
52
53
54
55
56
57
58
59
60
61
62
63
64
65
66
67
68
69
70
71
72
73
74
75
76
77
78
79
80
81
82
83
84
85
86
87
88
89
90
91
92
93
94
95
96
97
98
99
100
101
102
103
104
105
106
107
108
109
110
111
 %%% Full, compilable sources including data files are on Github:
%%% https://github.com/bvieuble/TeXFantasy/tree/main/bars/fig3
%%% Appears in my Ph.D. defense ``Mixed precision iterative refinement for the
%%% solution of large sparse linear systems''.

% Compiled with XeLaTeX
% Generate the GIF with convert -delay 100 -loop 0 -density 200 -alpha on
% file.pdf file.gif (package imagemagick is required).
\documentclass[tikz,border=10pt]{standalone}
\usepackage{pgfplots,pgfplotstable}
\pgfplotsset{compat=newest}

\input{color_theme.tex}

\pgfplotstableread[col sep=comma]{data.csv}{\data}
\pgfplotsset{select coords between index/.style 2 args={
    x filter/.code={
        \ifnum\coordindex<#1\def\pgfmathresult{}\fi
        \ifnum\coordindex>#2\def\pgfmathresult{}\fi
    }
}}
\pgfplotstablegetrowsof{\data}
\pgfmathsetmacro{\nbrows}{\pgfplotsretval}

\begin{document}

\foreach \X in {0,1,2,3,4,5}
{\begin{tikzpicture}
    \begin{axis}[
        point meta=explicit symbolic,
        nodes near coords,
        every node near coord/.append style={font=\scriptsize,above},
        axis lines=left,
        width=1.1\linewidth,
        height=0.55\linewidth,
        xmin=-0.5,
        xmax=\nbrows,
        xtick=data,
        xticklabels from table={\data}{epsilon},
        x tick label style={font=\tiny},
        x tick style={thick},
        xlabel=$\epsilon_{\mbox{\tiny BLR}}$,
        xlabel style = {at={(axis description cs:1.02,0)},anchor=north east},
        ybar,
        ymajorgrids,
        ymin=0,
        ymax=1.45,
        ytick={0, 0.25, 0.5, 0.75, 1},
        yticklabels={0\%,25\%,50\%,75\%,100\%},
        y tick label style={font=\scriptsize},
        legend style={nodes={scale=0.7,transform shape},anchor=west,
            at={(axis cs:1.7,1.4)},legend columns=4,
            legend cell align=right, legend image post style={scale=0.5}},
        at={(0,0)},
    ]

        \addplot [opacity=0.,forget plot]
            table[x expr=\coordindex,y=sdd-lu,meta=sdd-lu-meta]
            {\data};

        \addplot [fill=myblue-mild,bar width=0.2,draw=none,bar shift=-0.2,
                  select coords between index={0}{0}]
            table[x expr=\coordindex,y=sdd-lu,meta=sdd-lu-meta]
            {\data};

        \addplot [fill=mygreen-mild,bar width=0.2,draw=none,bar shift=+0.2,
                  select coords between index={0}{0}]
            table[x expr=\coordindex,y=sdddd-gmres,meta=sdddd-gmres-meta]
            {\data};

        \addplot [fill=myyellow-mild,bar width=0.2,draw=none,bar shift=-0.2,
                  select coords between index={1}{\X}]
            table[x expr=\coordindex,y=sdd-lu,meta=sdd-lu-meta]
            {\data};

        \addplot [fill=mypurple-mild,bar width=0.2,draw=none,bar shift=+0.2,
                  select coords between index={1}{\X}]
            table[x expr=\coordindex,y=sdddd-gmres,meta=sdddd-gmres-meta]
            {\data};

        \addplot [fill=myblue-mild,bar width=0.2,draw=none,bar shift=-0.2,
                  select coords between index={7}{7}]
            table[x expr=\coordindex,y=sdd-lu,meta=sdd-lu-meta]
            {\data};

        \addplot [fill=mygreen-mild,bar width=0.2,draw=none,bar shift=+0.2,
                  select coords between index={7}{7}]
            table[x expr=\coordindex,y=sdddd-gmres,meta=sdddd-gmres-meta]
            {\data};

        \addplot [fill=myyellow-mild,bar width=0.2,draw=none,bar shift=-0.2,
                  select coords between index={8}{\the\numexpr\X+7\relax}]
            table[x expr=\coordindex,y=sdd-lu,meta=sdd-lu-meta]
            {\data};

        \addplot [fill=mypurple-mild,bar width=0.2,draw=none,bar shift=+0.2,
                  select coords between index={8}{\the\numexpr\X+7\relax}]
            table[x expr=\coordindex,y=sdddd-gmres,meta=sdddd-gmres-meta]
            {\data};

        \legend{LU-IR,LU-GMRES-IR,BLR-LU-IR,BLR-LU-GMRES-IR}

        \draw[-,thick,dashed] (axis cs:6,-0.1) edge (axis cs:6,1.1);
        \node[fill=gray!7,rounded corners=5pt] (n1) at (axis cs:0.5,1.3)
            {\footnotesize Time};
        \node[fill=gray!7,rounded corners=5pt] (n1) at (axis cs:11.5,1.3)
            {\footnotesize Memory};
    \end{axis}
\end{tikzpicture}}

\end{document}