Plots
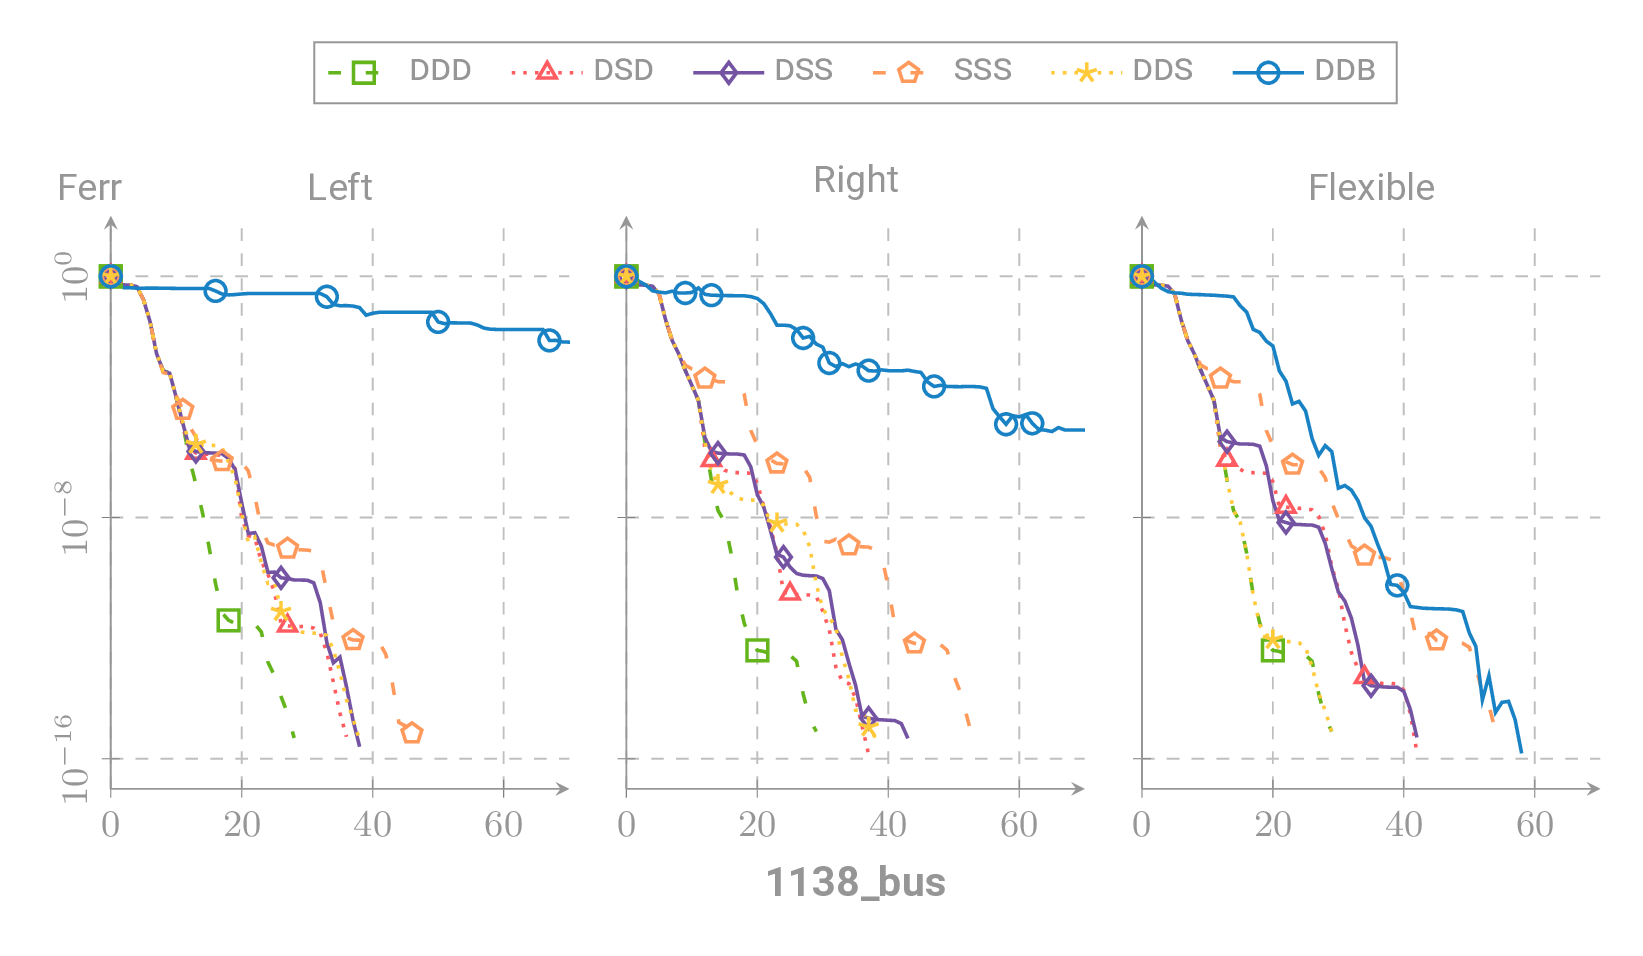
Plots representing the convergence of the left-, right-, and flexible-preconditioned GMRES errors.

1
2
3
4
5
6
7
8
9
10
11
12
13
14
15
16
17
18
19
20
21
22
23
24
25
26
27
28
29
30
31
32
33
34
35
36
37
38
39
40
41
42
43
44
45
46
47
48
49
50
51
52
53
54
55
56
57
58
59
60
61
62
63
64
65
66
67
68
69
70
71
72
73
74
75
76
77
78
79
80
81
82
83
84
85
86
87
88
89
90
91
92
93
94
95
96
97
98
99
100
101
102
103
104
105
106
107
108
109
110
111
112
113
114
115
116
117
118
119
120
121
122
123
124
125
126
127
128
129
130
131
132
133
134
135
136
137
138
139
140
141
142
143
144
145
146
147
148
 %%% Full, compilable sources including data files are on Github:
%%% https://github.com/bvieuble/TeXFantasy/tree/main/plots/fig4
%%% Appears in my article ``Mixed precision strategies for preconditioned
%%% GMRES: a comprehensive analysis''.

% Compiled with LuaLaTeX
% TeX-command-extra-options: "-shell-escape"
\documentclass[convert={outext=.png},border=10pt]{standalone}
\usepackage{fontspec}
\setmainfont{Roboto}
\usepackage{pgfplots}
\pgfplotsset{compat=newest}
\usepackage{amsmath}
\usepackage{luacode}

\input{color_theme.tex}
\pgfplotsset{filter discard warning=false}

\begin{document}
%
\begin{luacode*}
  myutils = require("utils")
  myconfig = require("config")
\end{luacode*}
%
\newcommand{\cvgsparse}
{ %
  \begin{axis}[
      legend columns = -1,
      legend style={at={(\varlegendx\linewidth,\varlegendy\linewidth)},
                    anchor=center, font=\small,fill=none, draw=fg,
                    /tikz/every even column/.append style={column sep=0.25cm},
                    },
      legend to name = plotlegend,
      axis x line=left,
      axis y line=middle,
      grid = major,
      grid style={dashed},
      width=\varxsize\linewidth,
      height=\varysize\linewidth,
      scale only axis=true,
      xmin= 0,
      xmax=\varmaxit,
      x tick label style={font=\small},
      xlabel=\varxlabel,
      ymin= 1e-17,
      ymax= 1e2,
      ymode=log,
      ytick={1e0, 1e-8, 1e-16},
      y tick label style={font=\small,rotate=90},
      yticklabels/.expand once = \varyticklabel,
      y label style={at={(axis description cs:-0.15,1.1)},rotate=0,font=\small},
      xlabel=\textbf{\varxlabel},
      ylabel=\varylabel,
      title style={yshift=-.2cm},
      title = {\small\vartitle},
      at={(\varcoordx,\varcoordy)},
    ]%
    \varplots
  \end{axis}
}%
%
\newcommand{\varplotline}[3]
{ %
  \addplot[mark=none,#1,color=#2,thick, forget plot] table[x=it, y=#3,
           col sep=comma] {\varpathcsv};
}%
%
\newcommand{\varplotmark}[3]
{ %
  \addplot[mark=#1,only marks,mark size=2.5pt,color=#2,thick, forget plot]
    table[x=it, y=#3, col sep=comma] {\varpathcsv};
}%
%
\newcommand{\varplotlegend}[3]
{ %
  \addplot[mark=#1, #2, mark size=2.5pt, mark options=solid,
           color=#3,thick] coordinates {(0.0, 1.0)};
}%
%
\begin{tikzpicture}[fg]
  \begin{luacode*}
      grid = myutils.get_grid(myconfig.title, myconfig.xsize, myconfig.ysize)

      left_right_flex = {myconfig.left, myconfig.right, myconfig.flexible}

      for j = 1, #left_right_flex
      do
        kind = left_right_flex[j]

        pathcsv = "./data/" .. myconfig.matrix .. "/" .. kind.csv

        line_plots = ""
        mark_plots = ""
        legend_plots = ""
        legend     = "\\legend{"

        for i = 1, #myconfig.plots
        do
            local line, mark, color = myutils.get_style()
            line_plots = line_plots ..
                "\\varplotline{" .. line .. "}" ..
                "{" .. color .. "}" ..
                "{" .. myconfig.plots[i] .. "} "

            mark_plots = mark_plots ..
                "\\varplotmark{" .. mark .. "}" ..
                "{" .. color .. "}" ..
                "{" .. myconfig.plots[i] .. "-rstrt" .. "} "

            legend_plots = legend_plots ..
                "\\varplotlegend{" .. mark .. "}" ..
                "{" .. line .. "}" .. "{" .. color .. "} "

            legend = legend .. "\\textsc{" .. myconfig.plots[i] ..
                "}" .. ", "
        end
        legend     = legend .. "}"

        if myconfig.header then
            tex.print("\\def\\vartitle{"   .. grid.title[j] .. "}")
        else
            tex.print("\\def\\vartitle{ {} }")
        end

        tex.print("\\def\\varxsize{"   .. myconfig.xsize .. "}")
        tex.print("\\def\\varysize{"   .. myconfig.ysize .. "}")
        tex.print("\\def\\varmaxit{"   .. myconfig.maxit .. "}")
        tex.print("\\def\\varcoordx{"  .. grid.coordx[j]            .. "}")
        tex.print("\\def\\varcoordy{"  .. grid.coordy[j]            .. "}")
        tex.print("\\def\\varytick{"   .. grid.ytick[j]             .. "}")
        tex.print("\\def\\varxlabel{"  .. grid.xlabel[j]            .. "}")
        tex.print("\\def\\varylabel{"  .. grid.ylabel[j]            .. "}")
        tex.print("\\def\\varyticklabel{" .. grid.yticklabel[j]     .. "}")
        tex.print("\\def\\varpathcsv{" .. pathcsv                   .. "}")
        tex.print("\\def\\varplots{ "  .. line_plots .. mark_plots ..
                  legend_plots .. legend .." }")
        tex.print("\\cvgsparse")
      end

      if myconfig.header then
        tex.print("\\def\\varlegendx{" .. grid.legendx .. "}")
        tex.print("\\def\\varlegendy{" .. grid.legendy .. "}")
        tex.print("\\ref{plotlegend}")
      end
  \end{luacode*}
\end{tikzpicture}%
\end{document}