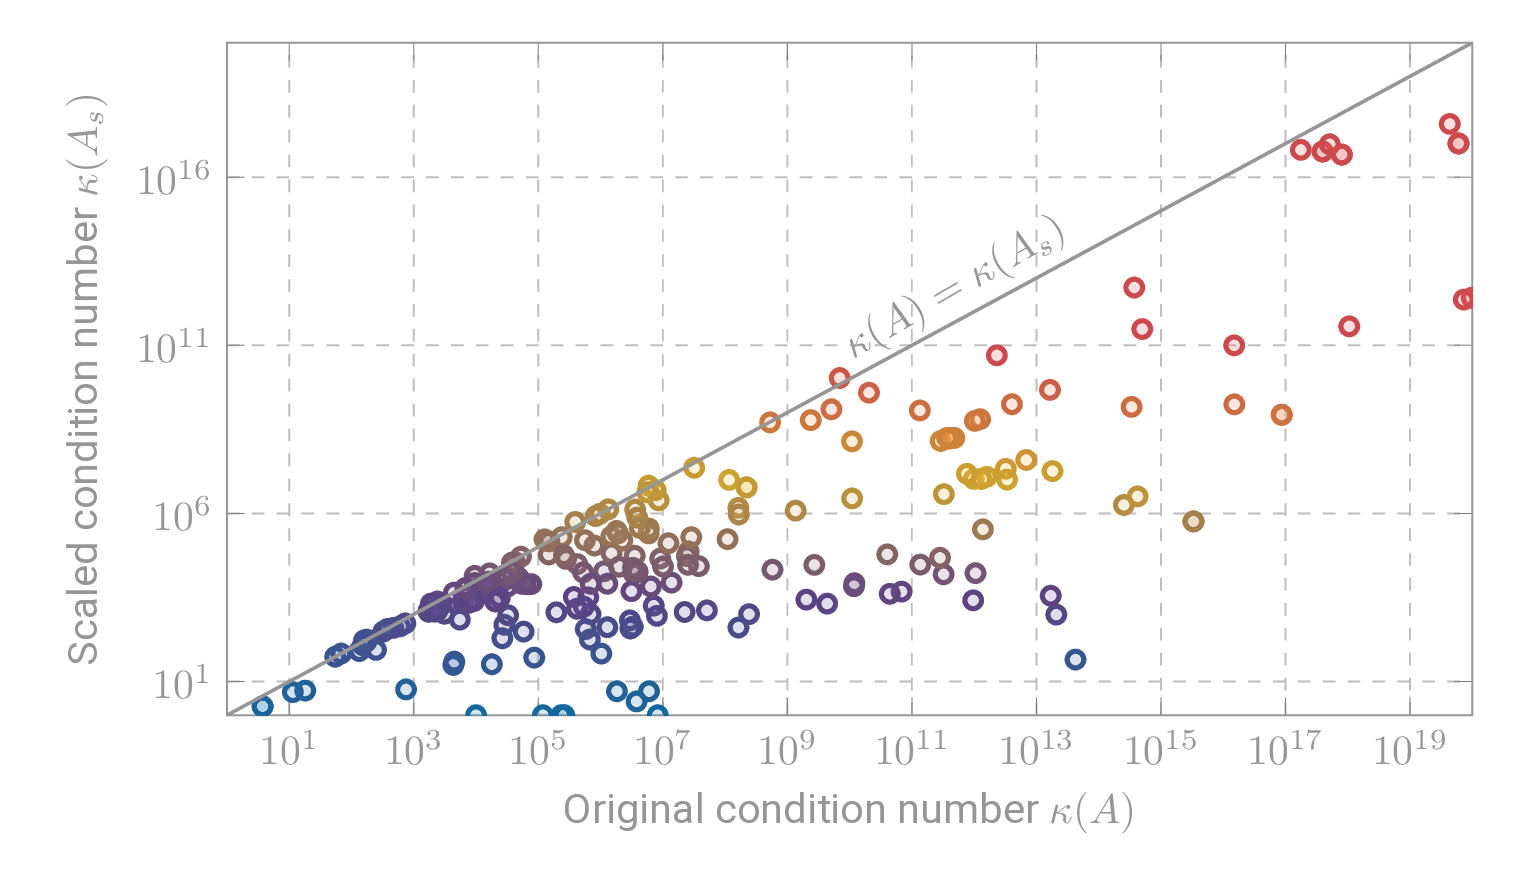
Scatter plot
A scatter plot representing the condition numbers of SuiteSparse matrices after scaling.

1
2
3
4
5
6
7
8
9
10
11
12
13
14
15
16
17
18
19
20
21
22
23
24
25
26
27
28
29
30
31
32
33
34
35
36
37
38
39
40
41
42
43
44
45
46
47
48
49
50
 %%% Full, compilable sources including data files are on Github:
%%% https://github.com/bvieuble/TeXFantasy/tree/main/scatter_plots/fig1
%%% Appears in my thesis ``Mixed precision iterative refinement for the
%%% solution of large sparse linear systems''.

% Compiled with XeLaTeX
% TeX-command-extra-options: "-shell-escape"
\documentclass[convert={outext=.png},border=10pt]{standalone}
\usepackage{tikz}
\usepackage{pgfplots, pgfplotstable}
\pgfplotsset{compat=newest}

\input{color_theme.tex}

\begin{document}
\pgfplotstableread[col sep=comma]{data.csv}{\data}

\begin{tikzpicture}
    \begin{axis}
    [
        width=1.\linewidth,
        height=0.6\linewidth,
        grid,
        grid style={dashed, mygray-light},
        xmin= 1.,
        xmax= 1e20,
        xmode=log,
        xlabel=Original condition number $\kappa(A)$,
        ymin= 1.,
        ymax= 1e20,
        ymode=log,
        ylabel=Scaled condition number $\kappa(A_s)$,
        enlargelimits=false,
        colormap={}{color={myblue} color={mypurple} color={myyellow}
                    color=(myred) color=(myred) color=(myred)}
    ]

        \addplot[scatter,very thick,only marks,clip mode=individual,
                 mark size=2pt,fill opacity=0.2,mark=*]
            table[x=kbef,y=kaft] {\data};

        \draw[black, thick]
            (axis cs:1e0,1e0) --
            (axis cs:1e20,1e20);

        \node[rotate=30] at (5e11,5e12) (id) {$\kappa(A)=\kappa(A_s)$};
    \end{axis}
\end{tikzpicture}

\end{document}