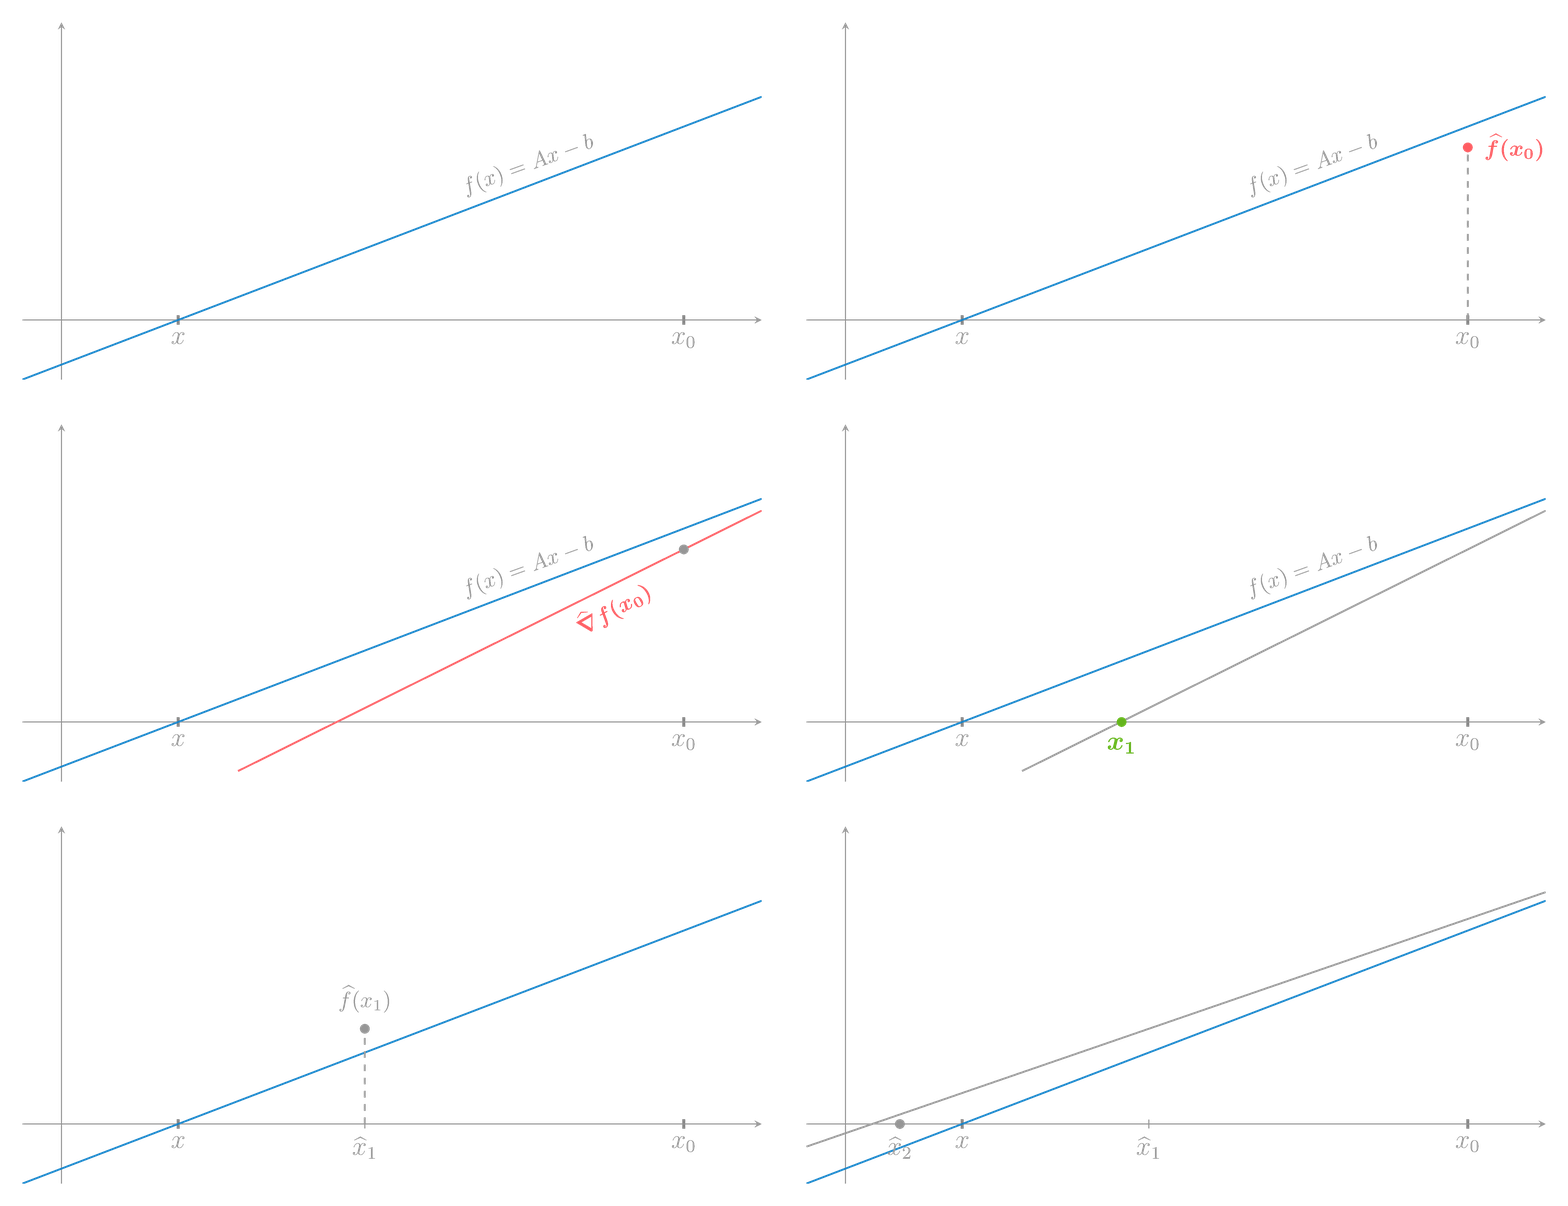
Function (gif)
An animated plot representing the convergence of iterative refinement.

1
2
3
4
5
6
7
8
9
10
11
12
13
14
15
16
17
18
19
20
21
22
23
24
25
26
27
28
29
30
31
32
33
34
35
36
37
38
39
40
41
42
43
44
45
46
47
48
49
50
51
52
53
54
55
56
57
58
59
60
61
62
63
64
65
66
67
68
69
70
71
72
73
74
75
76
77
78
79
80
81
82
83
84
85
86
87
88
89
90
91
92
93
94
95
96
97
98
99
100
101
102
103
104
105
106
107
108
109
110
111
112
113
114
115
116
117
118
 %%% Full, compilable sources are on Github:
%%% https://github.com/bvieuble/TeXFantasy/tree/main/illustrations/fig2
%%% Appears in my lecture ``Mixed precision iterative refinement'' (2023).

% Compiled with XeLaTeX
% Generate the GIF with convert -delay 100 -loop 0 -density 200 -alpha on
% file.pdf file.gif (package imagemagick is required)
\documentclass[tikz,border=10pt]{standalone}
\usepackage{pgfplots}
\pgfplotsset{compat=newest}
\usepackage{bm}

\input{color_theme.tex}

\newcommand{\alertgm}[1]{\color{mygreen} \bm{#1}}
\newcommand{\alertrm}[1]{\color{myred} \bm{#1}}

\begin{document}

\newcommand{\plota}{
  \addplot[myblue,no marks,domain=-0.5:9,thick] {0.5*x - 0.75};
  \node[rotate=20] at (axis cs:6,2.6) {$f(x) = Ax-b$};
}
\newcommand{\plotb}{
    \addplot[myblue,no marks,domain=-0.5:9,thick] {0.5*x - 0.75};
    \draw [dashed,thick] (axis cs:{8,0}) -- (axis cs:{8,3.2});
	  \addplot [only marks,mygreen,mark=*] coordinates { (8,3.25) };
    \node at (axis cs:8,3.7) {$\alertgm{f(x_0)}$};
    \node[rotate=20] at (axis cs:6,2.6) {$f(x) = Ax-b$};
}
\newcommand{\plotc}{
    \addplot[myblue,no marks,domain=-0.5:9,thick] {0.5*x - 0.75};
    \draw [dashed,thick] (axis cs:{8,0}) -- (axis cs:{8,2.9});
	  \addplot [only marks,myred,mark=*] coordinates { (8,2.9) };
    \node at (axis cs:8.6,2.9) {$\alertrm{\widehat{f}(x_0)}$};
    \node[rotate=20] at (axis cs:6,2.6) {$f(x) = Ax-b$};
}
\newcommand{\plotd}{
    \addplot[myblue,no marks,domain=-0.5:9,thick] {0.5*x - 0.75};
    \addplot[mygreen,no marks,domain=-0.5:9,thick,restrict y to domain={-1:5}]
    {0.5*x - 1.1};
	  \addplot [only marks,mark=*] coordinates { (8,2.9) };
    \node[rotate=25] at (axis cs:7,2) {$\alertgm{\nabla f(x_0)}$};
    \node[rotate=20] at (axis cs:6,2.6) {$f(x) = Ax-b$};
}
\newcommand{\plote}{
    \addplot[myblue,no marks,domain=-0.5:9,thick] {0.5*x - 0.75};
    \addplot[myred,no marks,domain=-0.5:9,thick,restrict y to domain={-1:5}]
    {0.65*x - 2.3};
	  \addplot [only marks,mark=*] coordinates { (8,2.9) };
    \node[rotate=30] at (axis cs:7.1,1.9) {$\alertrm{\widehat{\nabla}
    f(x_0)}$};
    \node[rotate=20] at (axis cs:6,2.6) {$f(x) = Ax-b$};
}
\newcommand{\plotf}{
    \addplot[myblue,no marks,domain=-0.5:9,thick] {0.5*x - 0.75};
    \addplot[no marks,domain=-0.5:9,thick,restrict y to domain={-1:5}]
    {0.65*x - 2.3};
	  \addplot [only marks,mygreen,mark=*] coordinates { (3.55,0) };
    \node[rotate=20] at (axis cs:6,2.6) {$f(x) = Ax-b$};
    \node at (axis cs:3.55,-0.4) {\large \alertgm{$x_{1}$}};
}
\newcommand{\plotg}{
    \addplot[myblue,no marks,domain=-0.5:9,thick] {0.5*x - 0.75};
    \addplot[no marks,domain=-0.5:9,thick,restrict y to domain={-1:5}]
    {0.65*x - 2.3};
	  \addplot [only marks,myred,mark=*] coordinates { (3.9,0) };
    \node[rotate=20] at (axis cs:6,2.6) {$f(x) = Ax-b$};
    \node at (axis cs:3.9,-0.4) {\large \alertrm{$\widehat{x}_{1}$}};
}
\newcommand{\ploth}{
    \addplot[myblue,no marks,domain=-0.5:9,thick] {0.5*x - 0.75};
    \draw [dashed,thick] (axis cs:{3.9,0}) -- (axis cs:{3.9,1.6});
	  \addplot [only marks,mark=*] coordinates { (3.9,1.6) };
    \node at (axis cs:3.9,2.1) {$\widehat{f}(x_1)$};
	  \addplot [only marks,mark=|] coordinates { (3.9,0) };
    \node at (axis cs:3.9,-0.4) {\large $\widehat{x}_{1}$};
}
\newcommand{\ploti}{
    \addplot[myblue,no marks,domain=-0.5:9,thick] {0.5*x - 0.75};
    \addplot[no marks,domain=-0.5:9,thick] {0.45*x - 0.155};
  	\addplot [only marks,mark=*] coordinates { (3.9,1.6) };
    \node[rotate=20] at (axis cs:2.7,1.5) {$\widehat{\nabla}f(x_1)$};
	  \addplot [only marks,mark=|] coordinates { (3.9,0) };
    \node at (axis cs:3.9,-0.4) {\large $\widehat{x}_{1}$};
}
\newcommand{\plotj}{
    \addplot[myblue,no marks,domain=-0.5:9,thick] {0.5*x - 0.75};
    \addplot[no marks,domain=-0.5:9,thick] {0.45*x - 0.155};
	  \addplot [only marks,mark=*] coordinates { (0.7,0) };
    \node at (axis cs:0.7,-0.4) {\large $\widehat{x}_{2}$};
	  \addplot [only marks,mark=|] coordinates { (3.9,0) };
    \node at (axis cs:3.9,-0.4) {\large $\widehat{x}_{1}$};
}

\foreach \whichplot in
    {\plota,\plotb,\plotc,\plotd,\plote,\plotf,\plotg,\ploth,\ploti,\plotj}
{\begin{tikzpicture}
    \begin{axis}
        [
            ymajorticks=false,
            xtick={8,1.5},
            xticklabels = {\large $x_0$, \large $x$},
            width=1.1\textwidth,
            height=0.6\textwidth,
            ymin=-1,
            ymax=5,
            xmax=9,
            xmin=-0.5,
            axis lines=middle,
            tick style={black, very thick},
        ]

        \whichplot

    \end{axis}
\end{tikzpicture}}
\end{document}